

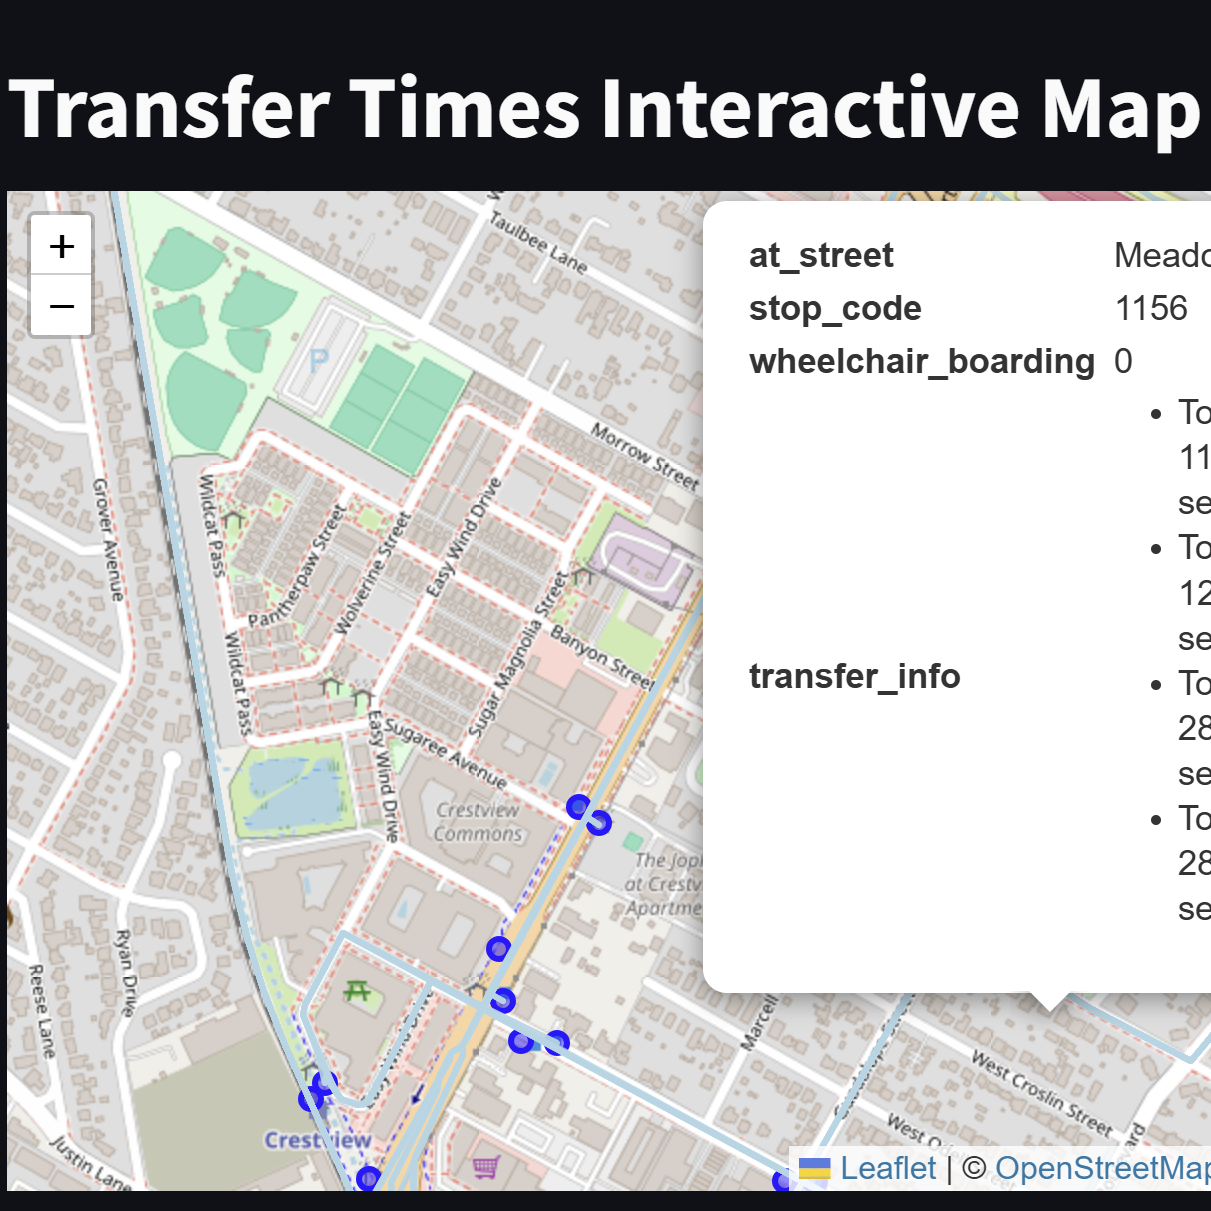
CityPulse is a web app organizing research, past ridership data, and interactive maps for Austin Public Transportation into an intuitive user interface. This project was developed in collaboration with about 10 other students from Aggie Data Science Club; I organized and led meetings and development. We utilized GeoPandas to implement bus stop/route and traffic datasets in interactive maps. We also proposed improvement plans helping recover Austin Public Transportation ridership post-pandemic. For the first week of thedevelopmentt process, I taught students how to use pandas and GeoPandas with Visual Studio Code. The following week, I taught students how to develop interactive maps based on Austin Public Transporation Data in GeoPandas. The last two weeks of the project were focused on finalizing our interactive maps and research, which were implemented into our web app.
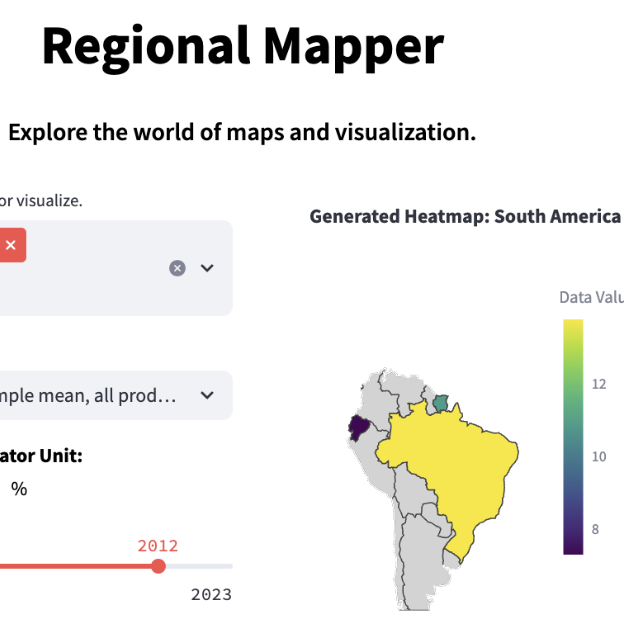
Interactive World Data Mapping is a web app that compares various country metrics (economics, climate, disease), and allows users to run predictive simulations on variable data. I was a Co-Project Manager along with one other student for this project, as part of Aggie Data Science Club. I developed an XML dynamic-map model for South America, which as implemented into the web app. Users of this web app can compare life metrics between countries, as well as develop charts and graphics for on-the-fly data visualization.

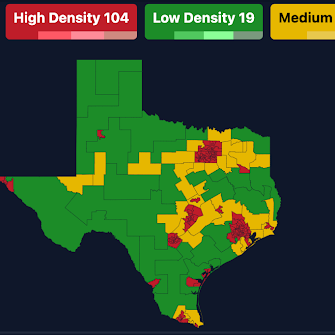
Improving Ridesharing Efficiency was a project that I worked on, in collaboration with General Motors, as part of Aggie Data Science Club. I worked on and presented this project with two other students from ADSC. This project involved developing a population density map model to visualize the reduction of road congestion and miles traveled without a passenger in ridesharing throughout the state of Texas. I also helped create a plan to optimize the 41% of ridesharing miles that are traveled without a pasenger, which is a relevant problem during the start and end of university breaks.